What is a Dark Cloud Cover Pattern?
All good things must come to an end. Just like storm clouds can roll in and spoil a bright, sunny day, a dark cloud cover pattern can also signal the end of bullish stock behavior. This candlestick reversal pattern is one that marks the shift in control from bulls to bears, and it’s usually followed by a price downtrend. Failing to recognize it can really rain on your parade, especially if you’re still bullish on a stock.
Dark cloud cover is a simple pattern that spans just three candles. Yet, being able to recognize it can prevent traders from incurring major losses that amount when the price begins to tumble towards a new support level. Here’s how to recognize a dark cloud cover, what it means and why traders can expect the share price to fall on the other side of this reversal pattern.

The Formation of a Dark Cloud Cover Pattern
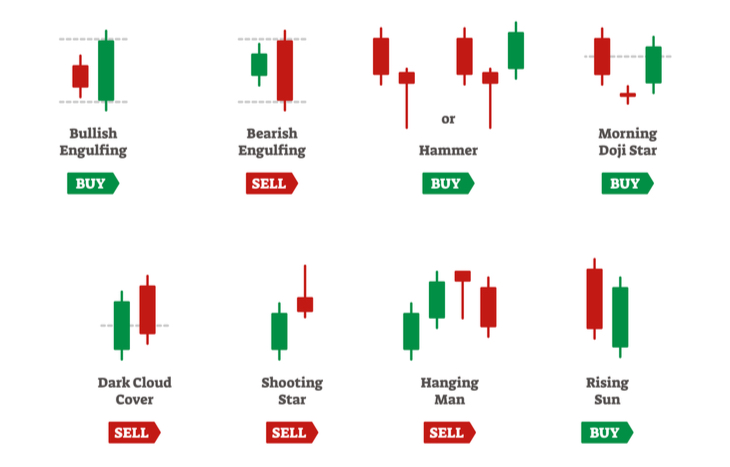
Dark cloud cover occurs at the peak of a stock’s current price momentum and represents an impending downturn. There are three candles that make up this pattern:
- Peak candle. A white candle representing the final bullish candle before the reversal.
- Cloud candle. A black candle representing the point of bearish reversal.
- Confirmation candle. A second black candle that confirms the start of a downtrend.
Dark cloud cover starts with a run-up: a stock that’s appreciating normally with strong bullish activity. The peak candle will appear as a bullish candle with a strong uptrend. However, the following bearish candle will gap up before trending down. The confirmation candle will also be bearish and may also gap down, depending on the strength of the reversal.
There are a few qualifying hallmarks to keep in mind when distinguishing dark cloud cover from other types of bearish reversal patterns:
- There needs to be a gap up from the bullish candle to the bearish candle.
- The bearish candle must close below the midpoint of the bullish candle.
- The pattern must form on an uptrend, following at least three bullish candles.
These criteria are important because they show, specifically, the power struggle between bulls and bears and the transition from bullish to bearish outlook in the stock’s price.
What’s Happening Behind the Scenes?
There’s some very specific psychology happening behind this candlestick pattern, and it’s important for traders to understand so they know how to make sense of the stock’s behavior. Here’s what’s happening:
- Bullish buyers push a stock higher and higher. This momentum pushes the price into a territory where sellers begin to take over. Investors take their profits or open short positions on the pretense of an overvalued price.
- At the point of reversal, bulls open the market strong; however, sellers quickly take over and drive the price down throughout the day. The price closes lower than the previous day’s median, signaling that bears maintain control.
- As the stock opens down on the following day, it’s confirmation that sellers continue to control the price, which will continue to fall as more traders exit their positions to take profits from the previous run-up.
The dark cloud cover pattern signals a quick reversal. As investors sell to take profits and others continue to sell for fear of losing them in the downturn, the stock price corrects significantly. How significant is unknown until buyers feel confident enough to step in and create support.
Factors to Consider When Analyzing This Pattern
Because they’re quick to form, trend strength is extremely important when assessing a dark cloud cover pattern. Traders should keep these variables in mind:
- The longer the candles, the more severe the trend is and the more dramatic the swing.
- Dark cloud cover following sideways trading is less likely to result in a reversal.
- Shorter candlestick wicks suggest decisive price action, lending credence to the pattern.
- The stronger the confirmation candle, the more dramatic the downtrend will likely be.
Traders should also pay attention to volume during this pattern’s formation. Strong volume consistent with the hallmarks of the dark cloud cover suggests that bears have stepped in decisively to take control of the stock. Conversely, lower volume could be a false indicator that allows bulls to step in and reestablish control.
How to Trade Dark Cloud Cover
Trading dark cloud cover patterns depends on your position. If you’re already long on the stock, it’s best to exit soon after the confirmation candle. The following trading periods are likely to see the price fall lower. It’s smart to set a stop-loss just below the low price of the bullish candle in the pattern’s formation (if the price hasn’t already fallen below it).
If entering a short position, traders can place a stop loss just above the first bearish candle in the pattern’s formation and set a price target at or below the last support level established before the price run-up. Keep in mind that there’s no specific way to gauge a price target for this pattern, other than to look at the relative strength of the reversal.
Don’t Let Dark Cloud Cover Patterns Ruin Your Day
When you spot a dark cloud forming on a stock chart, make sure you’re acting appropriately. It’s your sign that a bullish run has come to an end and that bearish days are ahead. Long investors should exit their positions before they see recent gains erased, and short-sellers should prepare to ride the price down to untold lows. Just be wary of factors like volume and candle length to confirm the gathering storm.
[adzerk-get-ad zone="245143" size="4"]


